Bubbles of denial about the 2020 U.S. presidential election are a matter of perception. Evidence, transparency and critical scrutiny are the best tools to burst them.
There are two opposing views of the U.S. presidential election outcome. Each is seen by the other as indulging an alternative reality, a fantasy, a bubble. Bubbles exist, and usually get popped, shrink or fizzle out in the face of evidence and investigation. One side claims that the U.S. election was free, fair and secure and produced Joe Biden as the winner. The other side calls foul and says that the election was rigged, stolen and fraudulent. However, there is only one side, increasingly with every passing day, who are refusing to even countenance that the other side has any evidence or any tenable case. It is the same side who have been, in general, decrying Donald Trump presidency as one defined by racism, narcissism and undiplomatic bullying. If there’s a fear of transparency and investigation, is there something being hidden ? This lack of scruple around due-process goes hand-in-hand with the Democrats’ ever increasing departure from law-and-order which has seen looting, rioting and violence across North America this summer with little explicit condemnation in name (Antifa) by the Democrat Party. It goes hand-in-hand with the resistance to voter-id, legality when it comes to immigration and the promotion of defunding the police. It should have been no surprise to anyone that the shops in U.S. cities were boarded up prior to the election in case Trump won – not in case he lost. Add to this the irony that the Democrats and their supporters like to think they are defeating fascism.
The media don’t declare the who becomes the President – the electors do. The process by which this is done is guaranteed by the U.S. constitution, whose writers and framers constructed to protect from the exact kind of wilfully ignorant mob-rule corruption we are seeing now in Democrat-run cities. One of the grievances of Democrats about the 2016 election was that Mrs. Clinton won the popular vote and that she should have been elected on that basis. But this sidelines the fact that the U.S. is a federal republic which protects the franchise of each member state. If the election fraud claims of the Trump’s lawyers hold water, it may transpire that he won the popular vote as well as the electoral college. It would mean that many would wake up from a dream into a nightmare, but if the truth of it is brought to light, then that is what we have to accept.
Now, we have something of a media and big-tech ‘platform’ black-out on election fraud. It is a general extension of the kind of shadow-banning, correction-tagging and outright censorship of political views about election fraud by social media platforms on-line. These platforms (who are really more like publishers) care as much about Republican views and pro-Trump opinions as a corrupt anti-Trump election official for a voting ballot with a black dot next to Trump/Pence’s names. One of the things democracy needs to function well is the free-flow of information. I would argue that, along with the shirking of due-process for establishing election integrity the main-stream media and the social media platforms have a lot of answer for in suppressing information (some true, some false, but let’s let it flow and be debunked or confirmed in due time). It’s similar to the way defence of Trump’s presidential record gets shut down in supposedly polite conversation (if it’s even allowed to start).
The outer membrane of the liberal, progressive, anti-Trump, pro-Democrat bubble is undulating and ready to pop. According to Sidney Powell, the well-respected (with a 70 % overturn rate) appellant lawyer on the Trump campaign, they have enough evidence “to overturn the election result in several states”. Another senior member of the team (who until he went to bat for Trump, was well-regarded in the mainstream press) Mr. Rudolph Giuliani says that they have hundreds sworn affidavits in Michigan alone (including military personnel, Democrat election officials and counting machine-technical support whistleblowers). At least six of those are public – do investigative journalists want to read them ? The rest are not public yet, because there is fear that if they are made public, the signatories would be on the receiving end of intimidation as some of the six have been. The same is true of the lawyers who had to leave the Trump campaign. They didn’t abandon the case because it was untenable, they had to abandon it because it is ! The same is true, I would imagine, of the justices. If they ruled in such a way that would recognise as much fraud as would overturn the election, would be effectively declaring civil war and would be signing their own death warrant.
Members of the public don’t have access to the ballots to inspect them and likely never will (even courts, observers and justices have been having a hard time trying to access them). But what we do have access to are numbers and the numbers tells a very fishy story. The application of Benford’s Law is a technique used by forensic accountants to detect fraud in, for example, expense reports. Benford’s law gives the probability of the occurrence of a given leading digit in a steam of data. The digit ‘1’ would occur on average the highest number of times in a given range of data, simply because, if you measured the length of randomly (when I used the word random here, I mean uncorrelated) collected objects with lengths between 0 and 2 metres, you would expect to get measurements with the leading digit equal to ‘1’ about 55 % of the time. This is just because half of all of them measurements would lie between 100 and 200 centimetres and therefore would all start with the first digit. Then add to that any of the measurements from the 10 cm to 20 cm range, and you have 55 % of the numbers. The trend is downhill from there, because as you cumulatively expand the ranges to account for more data, the lower-range data still has an edge in terms of counting and you get the following idealised trend P(d) = log10(1+1/d) . This is what an ideal Benford’s Law graph would look like this :

Departures from that indicate something or someone feeding in numbers non-randomly (i.e. in some correlated fashion) like some one submitting the same receipt again and again to syphon off money from a business. Or if someone is dropping large ballot drops of the same size for one candidate. So, when it came to light that Biden’s vote total data didn’t follow Benford’s Law, but Trumps did, there was a bit of worry from media outlets sympathetic to the Biden cause (or perhaps just antagonistic to the Trump campaign). The explanation they offered was that there was nothing to see here which was said up front and loudly by any number of podcasts and fact-checkers. The reason for the dismissal ? Benford’s Law doesn’t apply. Go elsewhere. Buried at the bottom of these fast fact checks and supposedly final-word correctives is the idea that, since in urban districts voting precincts are broken up into electorates of the same size – say 1000, so that in a two-horse presidential race, vote totals would cluster around numbers with leading digits of 4,5,6 (and same would apply to Trump’s totals per precinct anyway). For Benford’s Law to apply, you need to collect the data in an uncorrelated way, not broken down by packets of the same size, but collected in random buckets like counties (which are of randomly varying sizes). So, if you collected the votes that way (and votes are collected and reported that way in the final analysis), you can see a marked divergence from Benford’s Law in Biden’s data, but not in Trumps. And it is at the level of the county, and not at the level of the precinct, that the fraudulent votes were injected. Left-wing, pro-Biden, pro-Democrat, liberal media outlets played to many people’s confirmation bias with an appeal to authority and a flimsy excuse which crumbles under closer analysis. Many were satisfied, I suppose, that these forays into numerical analysis were enough not to look at the matter further. “Carry on” many were told, “nothing to see here”. But there is more to see here, and it’s ugly.

Trumps’s data follows Benford’s Law and actually serves as a guide curve to show how clearly Biden’s county totals diverge from it. That divergence is present in all swing states.
The main difference in features between Biden’s Benford graph and Trump’s is that, in almost every swing state, there is a bump or knee at d=4 and d=6 and you can see it clearly in the graph above which shows summed vote totals in terms of leading digit – it’s a persistent, common feature across all swing states and it could well be due to the non-random skewing of the vote totals per county in volumes big enough the affect the value of the leading digit in those reported vote totals. Doug Ross’ vote difference analysis (see below graph) shows periods of time where Trump’s vote totals stay static with respect to Biden, but that Biden ‘jumps ahead’ in very similar-sized jumps of around 6,000 (in PA) and 4,800 (in GA), due, according to Ross, to switches from Trump to Biden performed in the ‘smartmatic’ software components which the Dominion voting machines purportedly use. Take a look at the time-series of published vote totals by the N.Y. Times (hardly partial to Trump) collected in a spreadsheet here and tabulated for vote differences over time by Ross :

Source : https://directorblue.blogspot.com/2020/11/dna-level-statistical-proof-smartmatic.html
The flimsy explanation offered by many media outlets at the time (to account for delay if not stoppage) was centred around the fact that mail-in voting was much more popular with Democrat voters and that counting rules were different in the states like Pennsylvania and Arizona, so that vote had to be counted much later than Election Day, whereas states like Florida could count mail-in ballots straight away (and hence could report that Donald Trump had won outright very early on). However, Florida has exactly the same processing/counting rules as Arizona (see https://ballotpedia.org/When_states_can_begin_processing_and_counting_absentee/mail-in_ballots,_2020) and Ohio had well over 3 million mail-in ballots to count (which is far more than the 2.6 million reported in Pennsylvania and has similar counting/processing rules to that state) yet Ohio turned solidly red (again, on election night – why couldn’t those states like PA, GA, MI, WI, AZ, NV finish up in the same timely fashion ? ). Why did we have to wait days on end for these cluster of swing states to reporting their counts. To play catch-up, probably.
I remember looking at how results were shaping up on election night and even the morning after election night, I remember thinking – wow – this is turning out to be a landslide for Trump – Florida, Ohio, Texas and Iowa all in the bag and quickly called for him. Then I saw a broadcast from Trump election HQ saying with the president saying ‘we’re not going to let them get away with this’. Get away with what ? You’re winning ! But then, as the overnight vote counting stoppages in PA and GA and other swing states became apparent, and the day-by-day delays in calling each state ensued, it was clear that some kind of shenanigans were going on. The time series of the reported vote totals are helpful to flesh out the picture (again from the NY Times data) :

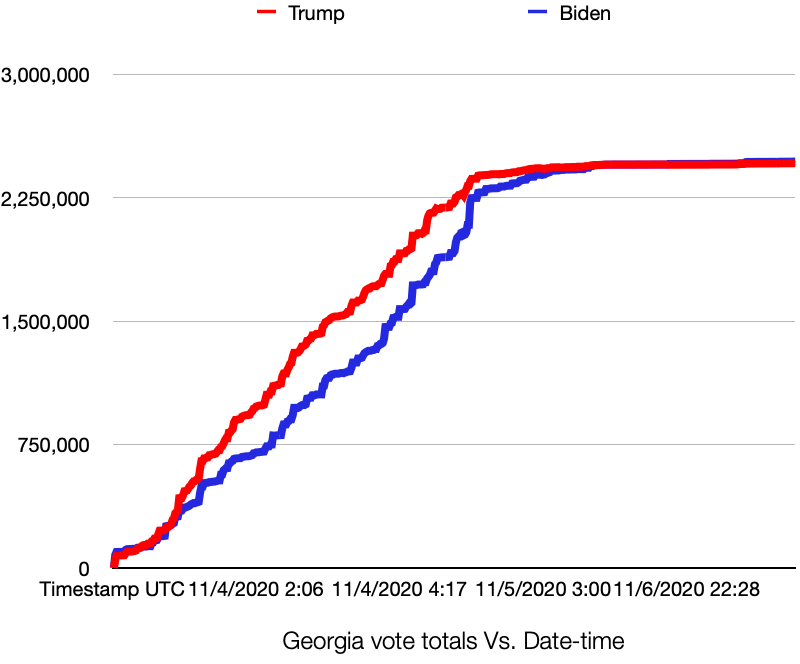
On the morning of the 4th in Pennsylvania, Trump’s vote count loses almost all momentum, and Biden’s creep forward until, finally, at about midday on the 6th of November, he catches up and barely overtakes him, but appears to come out 50 K ahead in the end. I suppose this is where accusations of back-dating ballots, sending out, receiving and counting mail-in ballots on the same day come into the picture, and the whole situation around having one set of rules for one state but not another, but I digress. The situation in Georgia is even stranger. It took until about 2 am on the 6th of November for Biden to ‘catch up’. At that point, the vote totals were exactly the same – an exact, numerical, dead-heat for a whopping 20 hours ! No vote different between then at all. They were locked in that numerical embrace for all that time, until finally at about 10 pm at night, Biden pushes ahead with a 4,969 vote lead until, 40 minutes later another stray vote comes in to put in at a 4,970 lead. He finished up at 2:50 am on the 10th of November (hmmm…the slow boat to China ?) with a 9976 vote lead. These graphs look less like impartial come-what-may vote counting in a very drawn-out and extremely close race and more like someone tying off the end of a bag with the Biden twisties pointing up.
The Trump votes had to be all counted, then the fraudsters likely had to scramble to make up the difference in Biden votes from whatever sources they had fabricated (including software-driven changes). It was a panic because they had underestimated the margins by which Trump was going to win. That things were done in a rush would also explain why the senatorial/house candidates were not picked in accordance with the presidential candidate picked on the ballot (indeed sworn affidavits from Sydney Powell attest to the presence of disputed ballots which were only filled out for the presidential candidate). That Biden is the supposed winner and that there was a red wave in the senate/house races doesn’t tally anyway. Far from it being an indicator that if fraud took place, it must only take place perfectly and coherently and play consistently to Democrat Party interests. Quite the opposite. Fraud, like lies, are rarely perfect and that makes them detectable. Furthermore anti-Trump animus tends to transcend Democrat Party concerns, so I don’t think it’s that surprising that the fraud doesn’t extent to the candidates in other races down the ballot. The N. Y. Times data is available in JSON format here :
https://static01.nyt.com/elections-assets/2020/data/api/2020-11-03/race-page/<state>/president.json
where <state> stands for pennsylvania, georgia, etc. – all lower case.
Trey Trainor, the Federal Electoral Commission has questioned the legitimacy of the election. Philadelphia election officials refused to obey a court order from Supreme Court justice Samuel Alito to allow Republican monitors meaningful access to the vote counting there. There are also highly problematic aspects to the way voters in Democrat-strong counties were allowed to submit or verify their ballot days after the election itself, in violation of the constitutional equal protection under the law. Are the the anti-Trump media going to cover this properly ? Or are they going to stick their heads in the sand in case they bring to light the reality they thought was the alternative one ? When they pointed the finger at election interference in 2016, they might now have to come to terms with the fact that this was just projection, that there are four fingers pointing back at themselves. They are themselves guilty of the charges they have been levelling at Trump and his campaign.

Dear Mark
Hello from the UK. A very interesting analysis, thank you. I have not examine the matter in detail, but I have been suspicious from the beginning when the vote was declared. It made no sense given how useless Joe Biden had been during the campaign.
Your last sentence sums it up.
Kind regards
LikeLiked by 1 person